Question:
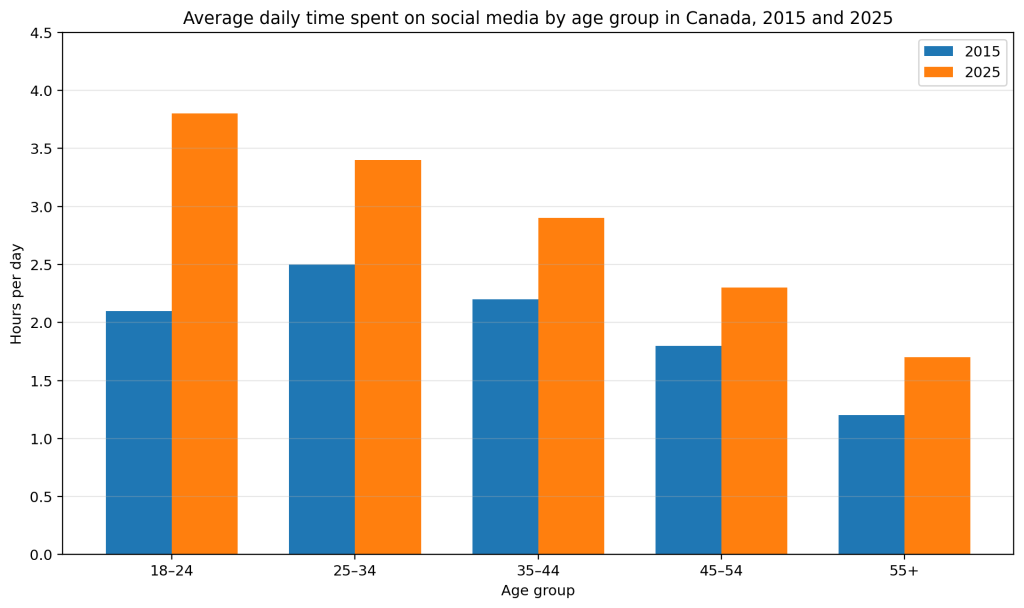
The bar chart below shows the average daily time spent on social media by five age groups in Canada in 2015 and 2025.
Summarise the information by selecting and reporting the main features, and make comparisons where relevant.
How to write it
Introduction
Paraphrase the task.
Overview
State the broad pattern across age groups and the main difference between 2015 and 2025.
Body paragraph 1
Describe the younger groups.
Body paragraph 2
Describe the older groups and compare the scale of change.
Main points students should notice
- Usage increased in every age group
- Younger adults spent more time on social media than older people in both years
- The 18–24 group was highest in 2025
- The 55+ group was lowest in both years
- The biggest increases happened in the younger groups
Band 6 sample
The bar chart compares the average number of hours per day spent on social media by five age groups in Canada in 2015 and 2025.
Overall, all age groups used social media more in 2025 than in 2015. Younger people spent more time on these platforms than older people in both years.
In 2015, the 25–34 group had the highest amount of daily use at 2.5 hours, followed by people aged 35–44 at 2.2 hours and the 18–24 group at 2.1 hours. The figures for older people were lower, at 1.8 hours for the 45–54 group and only 1.2 hours for those aged 55 and over.
By 2025, usage had increased across the board. The 18–24 group became the highest at 3.8 hours per day, while the 25–34 group reached 3.4 hours. People aged 35–44 spent 2.9 hours daily on social media, compared with 2.3 hours for the 45–54 group. The 55+ category still had the lowest figure, although it rose to 1.7 hours.
In summary, social media use rose for every age group, with the sharpest growth among younger adults.
Band 8 sample
The bar chart illustrates average daily social media use among five age groups in Canada in 2015 and 2025.
Overall, time spent on social media increased in every age category over the decade. In both years, younger adults were heavier users than older people, and by 2025 the 18–24 group had become the most active users overall.
In 2015, the highest average was recorded among 25–34-year-olds, at 2.5 hours per day. Those aged 35–44 and 18–24 followed at 2.2 and 2.1 hours respectively. Usage was lower among older Canadians, with the 45–54 group spending 1.8 hours daily and the 55+ category just 1.2 hours.
By 2025, social media use had risen substantially in all groups. The 18–24 category showed the highest figure at 3.8 hours, overtaking the 25–34 group, which reached 3.4 hours. The 35–44 group increased to 2.9 hours, while those aged 45–54 and 55+ recorded more modest figures of 2.3 and 1.7 hours. The most notable rises therefore occurred among the younger age groups, whereas the oldest group remained the least active in both years.
