Level: IELTS Academic Writing Task 1
Task type: Pie chart comparison
Recommended time: 20 minutes
Word count: At least 150 words
Task
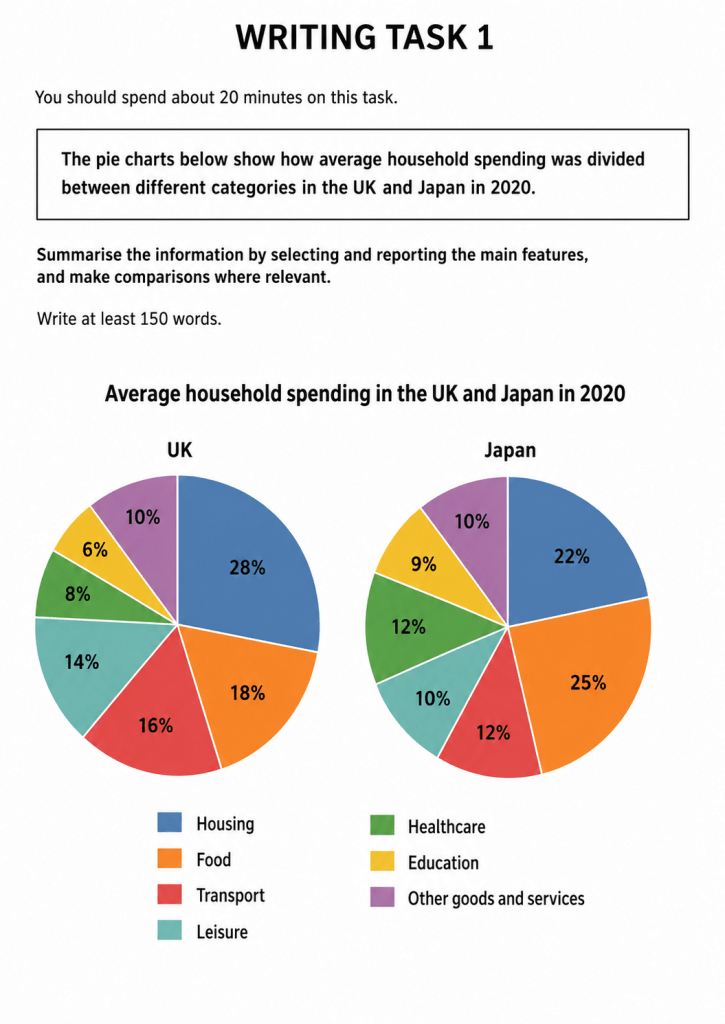
The pie charts below show how average household spending was divided between different categories in the UK and Japan in 2020.
Summarise the information by selecting and reporting the main features, and make comparisons where relevant.
Write at least 150 words.
How to approach this task
Start with a short introduction that paraphrases the question.
Then write an overview. This should describe the biggest overall patterns, not every number. For this pie chart task, focus on the largest spending categories in each country, the main differences between the UK and Japan and any categories where spending was the same.
After that, compare the largest categories first. In the UK, housing was the biggest area of spending, while in Japan, food accounted for the largest proportion. Housing, transport and leisure took up higher shares in the UK, whereas food, healthcare and education were higher in Japan.
Then describe the smaller categories. Mention that spending on other goods and services was identical in both countries, at 10%. Avoid listing the data mechanically. Group similar figures together and compare them directly.
Do not give opinions. Do not explain why households spent more or less in each category. Only describe and compare the information shown.
Useful language
Describing proportions
accounted for
made up
represented
comprised
took up
the largest proportion
the smallest share
just over a quarter
slightly less than a third
around one tenth
Comparing figures
was higher than
was lower than
was the same as
compared with
whereas
while
by contrast
in both countries
a similar proportion
a noticeably larger share
Useful pie chart phrases
household spending was divided into
the highest percentage was spent on
the lowest proportion was allocated to
spending on housing stood at 28%
food accounted for 25% in Japan
both countries spent the same proportion on
the figures for transport and leisure were higher in the UK
Practice task
Write your own answer in at least 150 words. Try to include:
a clear introduction
a clear overview
the largest and smallest categories
direct comparisons between the two countries
accurate percentage language
no personal opinion
no invented reasons
Example answers
Model answer: Band 6.5
The pie charts show how average household spending was divided between different categories in the UK and Japan in 2020.
Overall, housing was the largest area of spending in the UK, while food was the biggest category in Japan. The UK spent higher proportions on housing, transport and leisure, whereas Japan spent more on food, healthcare and education. Spending on other goods and services was the same in both countries.
In the UK, the biggest percentage of household spending went on housing, at 28%. Food was the second largest category, accounting for 18%, followed by transport at 16%. Leisure also made up a fairly large share, at 14%. By comparison, healthcare and education were smaller categories, representing 8% and 6% respectively.
In Japan, food was the largest category, at 25%, which was higher than the figure for the UK. Housing was the second biggest area of spending, at 22%. Transport and healthcare each accounted for 12%, while leisure made up 10%. Education was also higher in Japan than in the UK, at 9% compared with 6%. In both countries, other goods and services represented 10% of total household spending.
Model answer: Band 8.0
The pie charts compare the proportions of average household expenditure allocated to seven categories in the UK and Japan in 2020.
Overall, the main difference between the two countries was that housing accounted for the largest share of spending in the UK, whereas food was the leading category in Japan. British households spent proportionally more on housing, transport and leisure, while Japanese households allocated larger shares to food, healthcare and education. The only category with an identical figure was other goods and services.
In the UK, housing represented the highest proportion of household expenditure, at 28%, which was six percentage points higher than the equivalent figure for Japan. Food was the next largest category in the UK, making up 18% of the total. Transport and leisure were also significant areas of spending, at 16% and 14% respectively, both exceeding the Japanese figures of 12% and 10%.
By contrast, Japanese households spent the greatest proportion on food, which accounted for exactly a quarter of total expenditure, compared with 18% in the UK. Healthcare and education were also higher in Japan, at 12% and 9%, while the corresponding UK figures were 8% and 6%. Spending on other goods and services was the same in both countries, standing at 10%.
