Question:
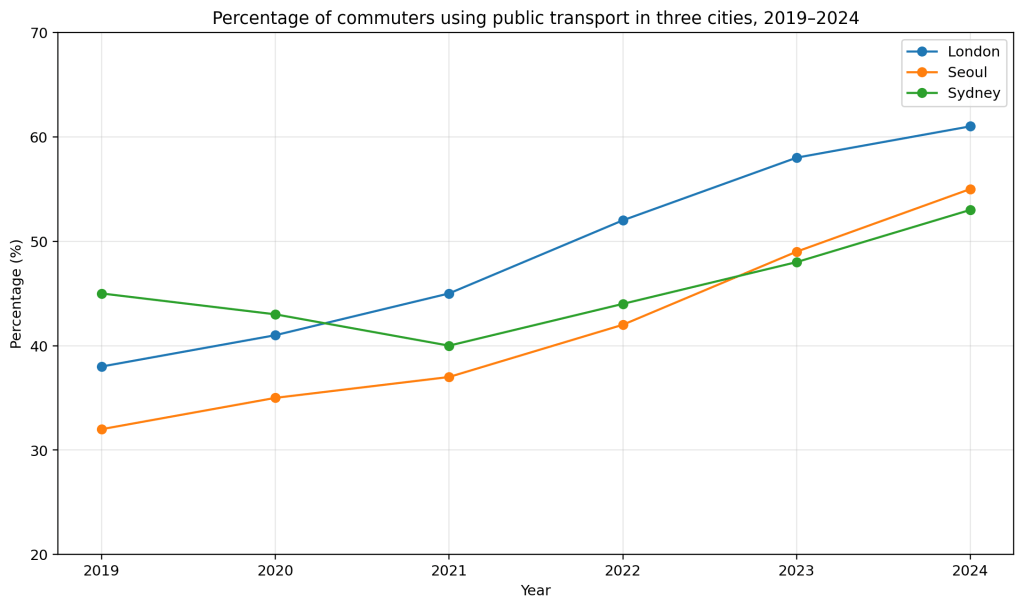
The line graph below shows the percentage of commuters who used public transport in London, Seoul and Sydney between 2019 and 2024.
Summarise the information by selecting and reporting the main features, and make comparisons where relevant.
How to write it
Introduction
Paraphrase the question.
Overview
Say which cities rose overall, which city started highest, and the most noticeable trend.
Body paragraph 1
Compare London and Seoul.
Body paragraph 2
Describe Sydney and compare its pattern with the other two cities.
Main points students should notice
- All three cities ended higher than they began
- Sydney started highest, then dipped before rising again
- London and Seoul both increased steadily
- London overtook Sydney by the end
- Seoul remained the lowest for most of the period, but rose strongly later
Band 6 sample
The line graph shows the percentage of people who travelled by public transport in London, Seoul and Sydney from 2019 to 2024.
Overall, public transport use increased in all three cities by the end of the period. Sydney had the highest figure at the beginning, but London became the highest in 2024.
In London, the proportion rose steadily from 38% in 2019 to 41% in 2020 and 45% in 2021. It then increased more quickly to 52% in 2022, 58% in 2023 and finally 61% in 2024.
A similar trend can be seen in Seoul, although the figures were lower throughout most of the period. It started at 32% in 2019 and climbed gradually to 35%, 37% and 42% over the next three years. After that, it went up more sharply to 49% in 2023 and 55% in 2024.
Sydney showed a different pattern. It began at 45%, fell to 43% in 2020 and 40% in 2021, then recovered to 44% in 2022. In the final two years, it continued to rise to 48% and then 53%.
Band 8 sample
The line graph compares the proportion of commuters using public transport in London, Seoul and Sydney between 2019 and 2024.
Overall, all three cities experienced an upward trend over the six-year period, although Sydney was the only city to show an initial decline before recovering. Sydney recorded the highest figure at the start, whereas London finished with the greatest share of public transport users.
In London, public transport use rose consistently from 38% in 2019 to 41% in 2020 and 45% in 2021. Growth then accelerated, with the figure reaching 52% in 2022, before climbing further to 58% in 2023 and 61% in 2024. Seoul followed a broadly similar trajectory but at a lower level. Its proportion increased from 32% to 35% and 37% in the first three years, then rose more markedly to 42%, 49% and finally 55%.
Sydney, by contrast, began at 45%, the highest of the three, but fell to 43% in 2020 and then to 40% in 2021. From that point onwards, however, it recovered steadily, rising to 44% in 2022, 48% in 2023 and 53% in 2024. Despite starting in the strongest position, Sydney was overtaken by London by the end of the period.
